Rewritten chart processing and tile generation pipeline
We've rebuilt our ENC chart processing and vector tile generation pipeline to fix a number of rendering issues and produce cleaner, more accurate charts.
We’ve rewritten the core chart processing and tile generation pipeline that turns raw ENC (Electronic Navigational Chart) data into the vector tiles served by our API. This addresses a number of rendering issues reported by users and lays the groundwork for further chart quality improvements.
What’s changed
- Cleaner water and land rendering — water and land polygons are now filtered strictly by geometry type before styling, eliminating stray line and point artifacts that could bleed into filled areas at certain zoom levels.
- Better depth band coloring — water areas now transition color more accurately across zoom levels, making it easier to visually distinguish freshwater bodies from open water and shallow depth bands.
- More accurate chart data overall — the underlying regeneration pass fixes a number of edge cases in how source ENC data was being converted to tiles, reducing rendering artifacts across a range of chart regions.
Before and after
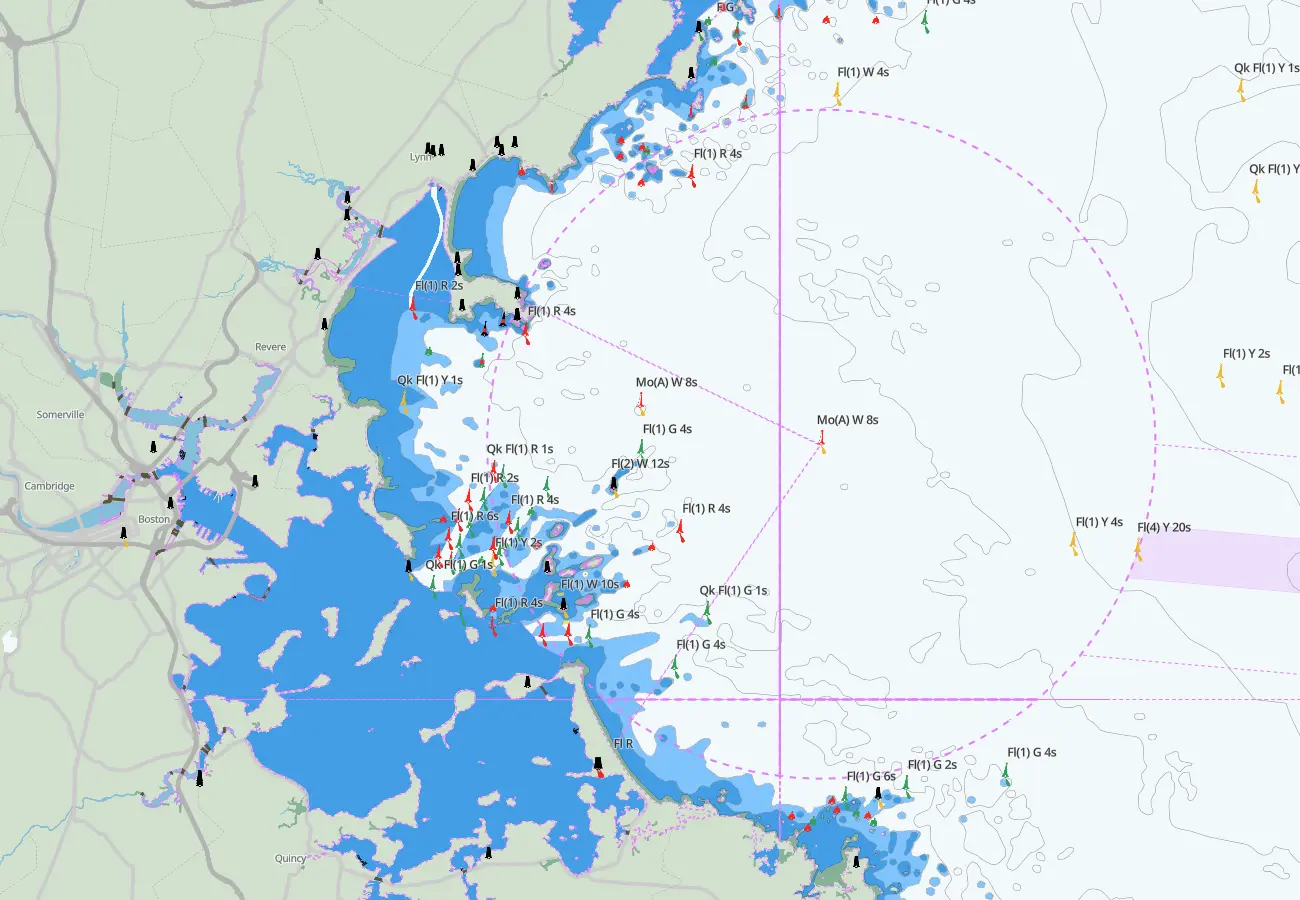
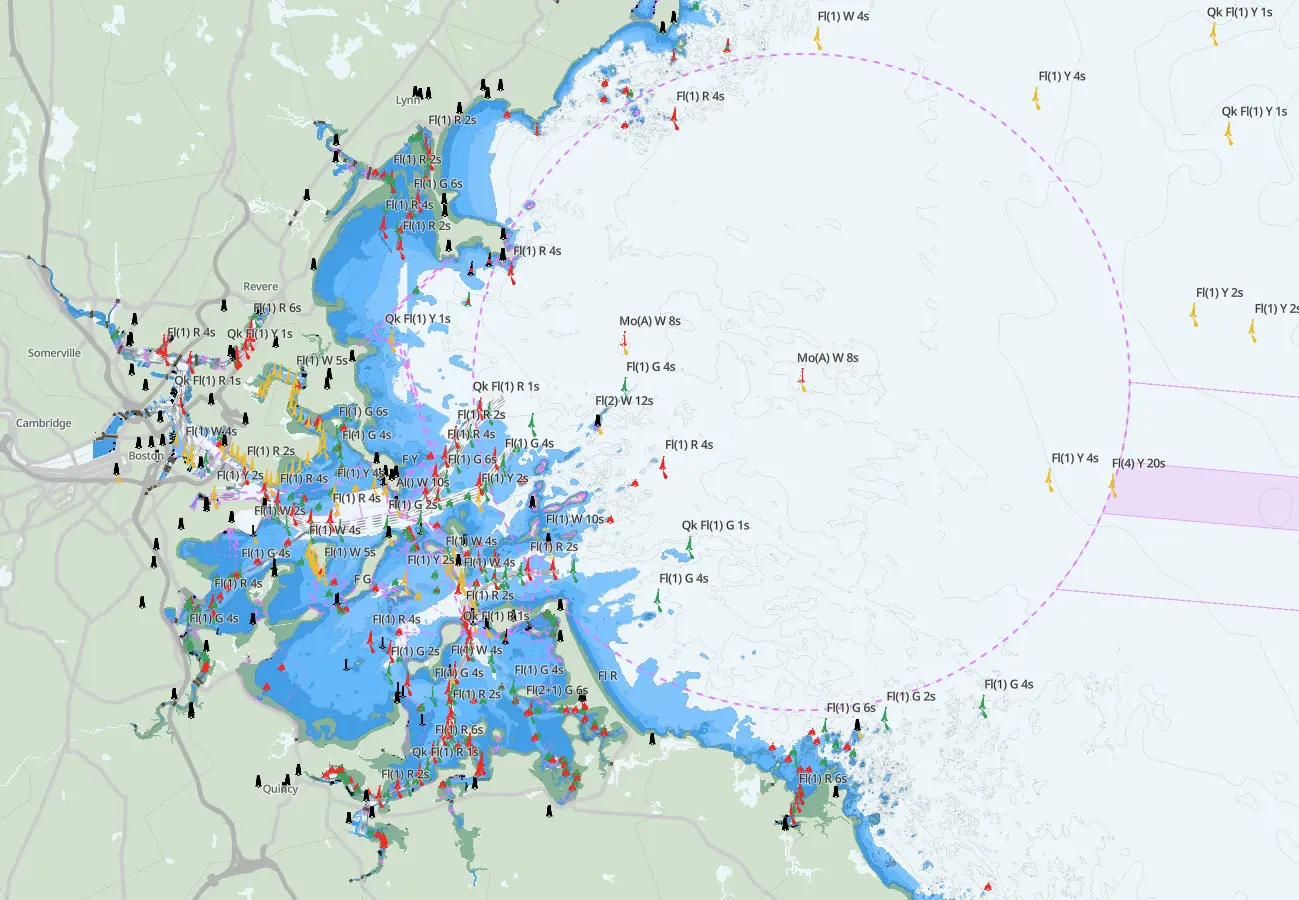
If you’re integrating with our tile API or embedding our basemap in your own MapLibre GL or Mapbox GL JS application, you don’t need to make any changes — the new tiles are served transparently through the existing endpoints.
As always, if you spot any rendering issues in your charts, reach out to us — we read every report.