Rendering NOAA charts with MapLibre GL
If you’ve ever tried to work with raw NOAA Electronic Navigational Chart (ENC) data, you know the pain: S-57 format files, complex processing pipelines, and the constant chore of keeping everything up to date. This tutorial shows you how to skip all of that and render a fully-featured interactive marine chart in minutes.
A working chart in 5 minutes
The fastest path uses the Marine Charts style endpoint, which returns a complete MapLibre style — sources, all ENC layers, depth colouring, buoys, lights, and soundings — in a single JSON document. You pass its URL directly to MapLibre and you’re done.
Create an index.html:
<!DOCTYPE html>
<html>
<head>
  <meta charset="utf-8" />
  <title>NOAA Marine Chart</title>
  <meta name="viewport" content="initial-scale=1,maximum-scale=1,user-scalable=no" />
  <link href="https://unpkg.com/maplibre-gl/dist/maplibre-gl.css" rel="stylesheet" />
  <script src="https://unpkg.com/maplibre-gl/dist/maplibre-gl.js"></script>
  <style>
    body { margin: 0; }
    #map { width: 100vw; height: 100vh; }
  </style>
</head>
<body>
<div id="map"></div>
<script>
  const map = new maplibregl.Map({
    container: 'map',
    style: 'https://tiles.marinecharts.io/api/style?token=YOUR_TOKEN',
    center: [-70.9, 42.35],
    zoom: 10
  });
</script>
</body>
</html>
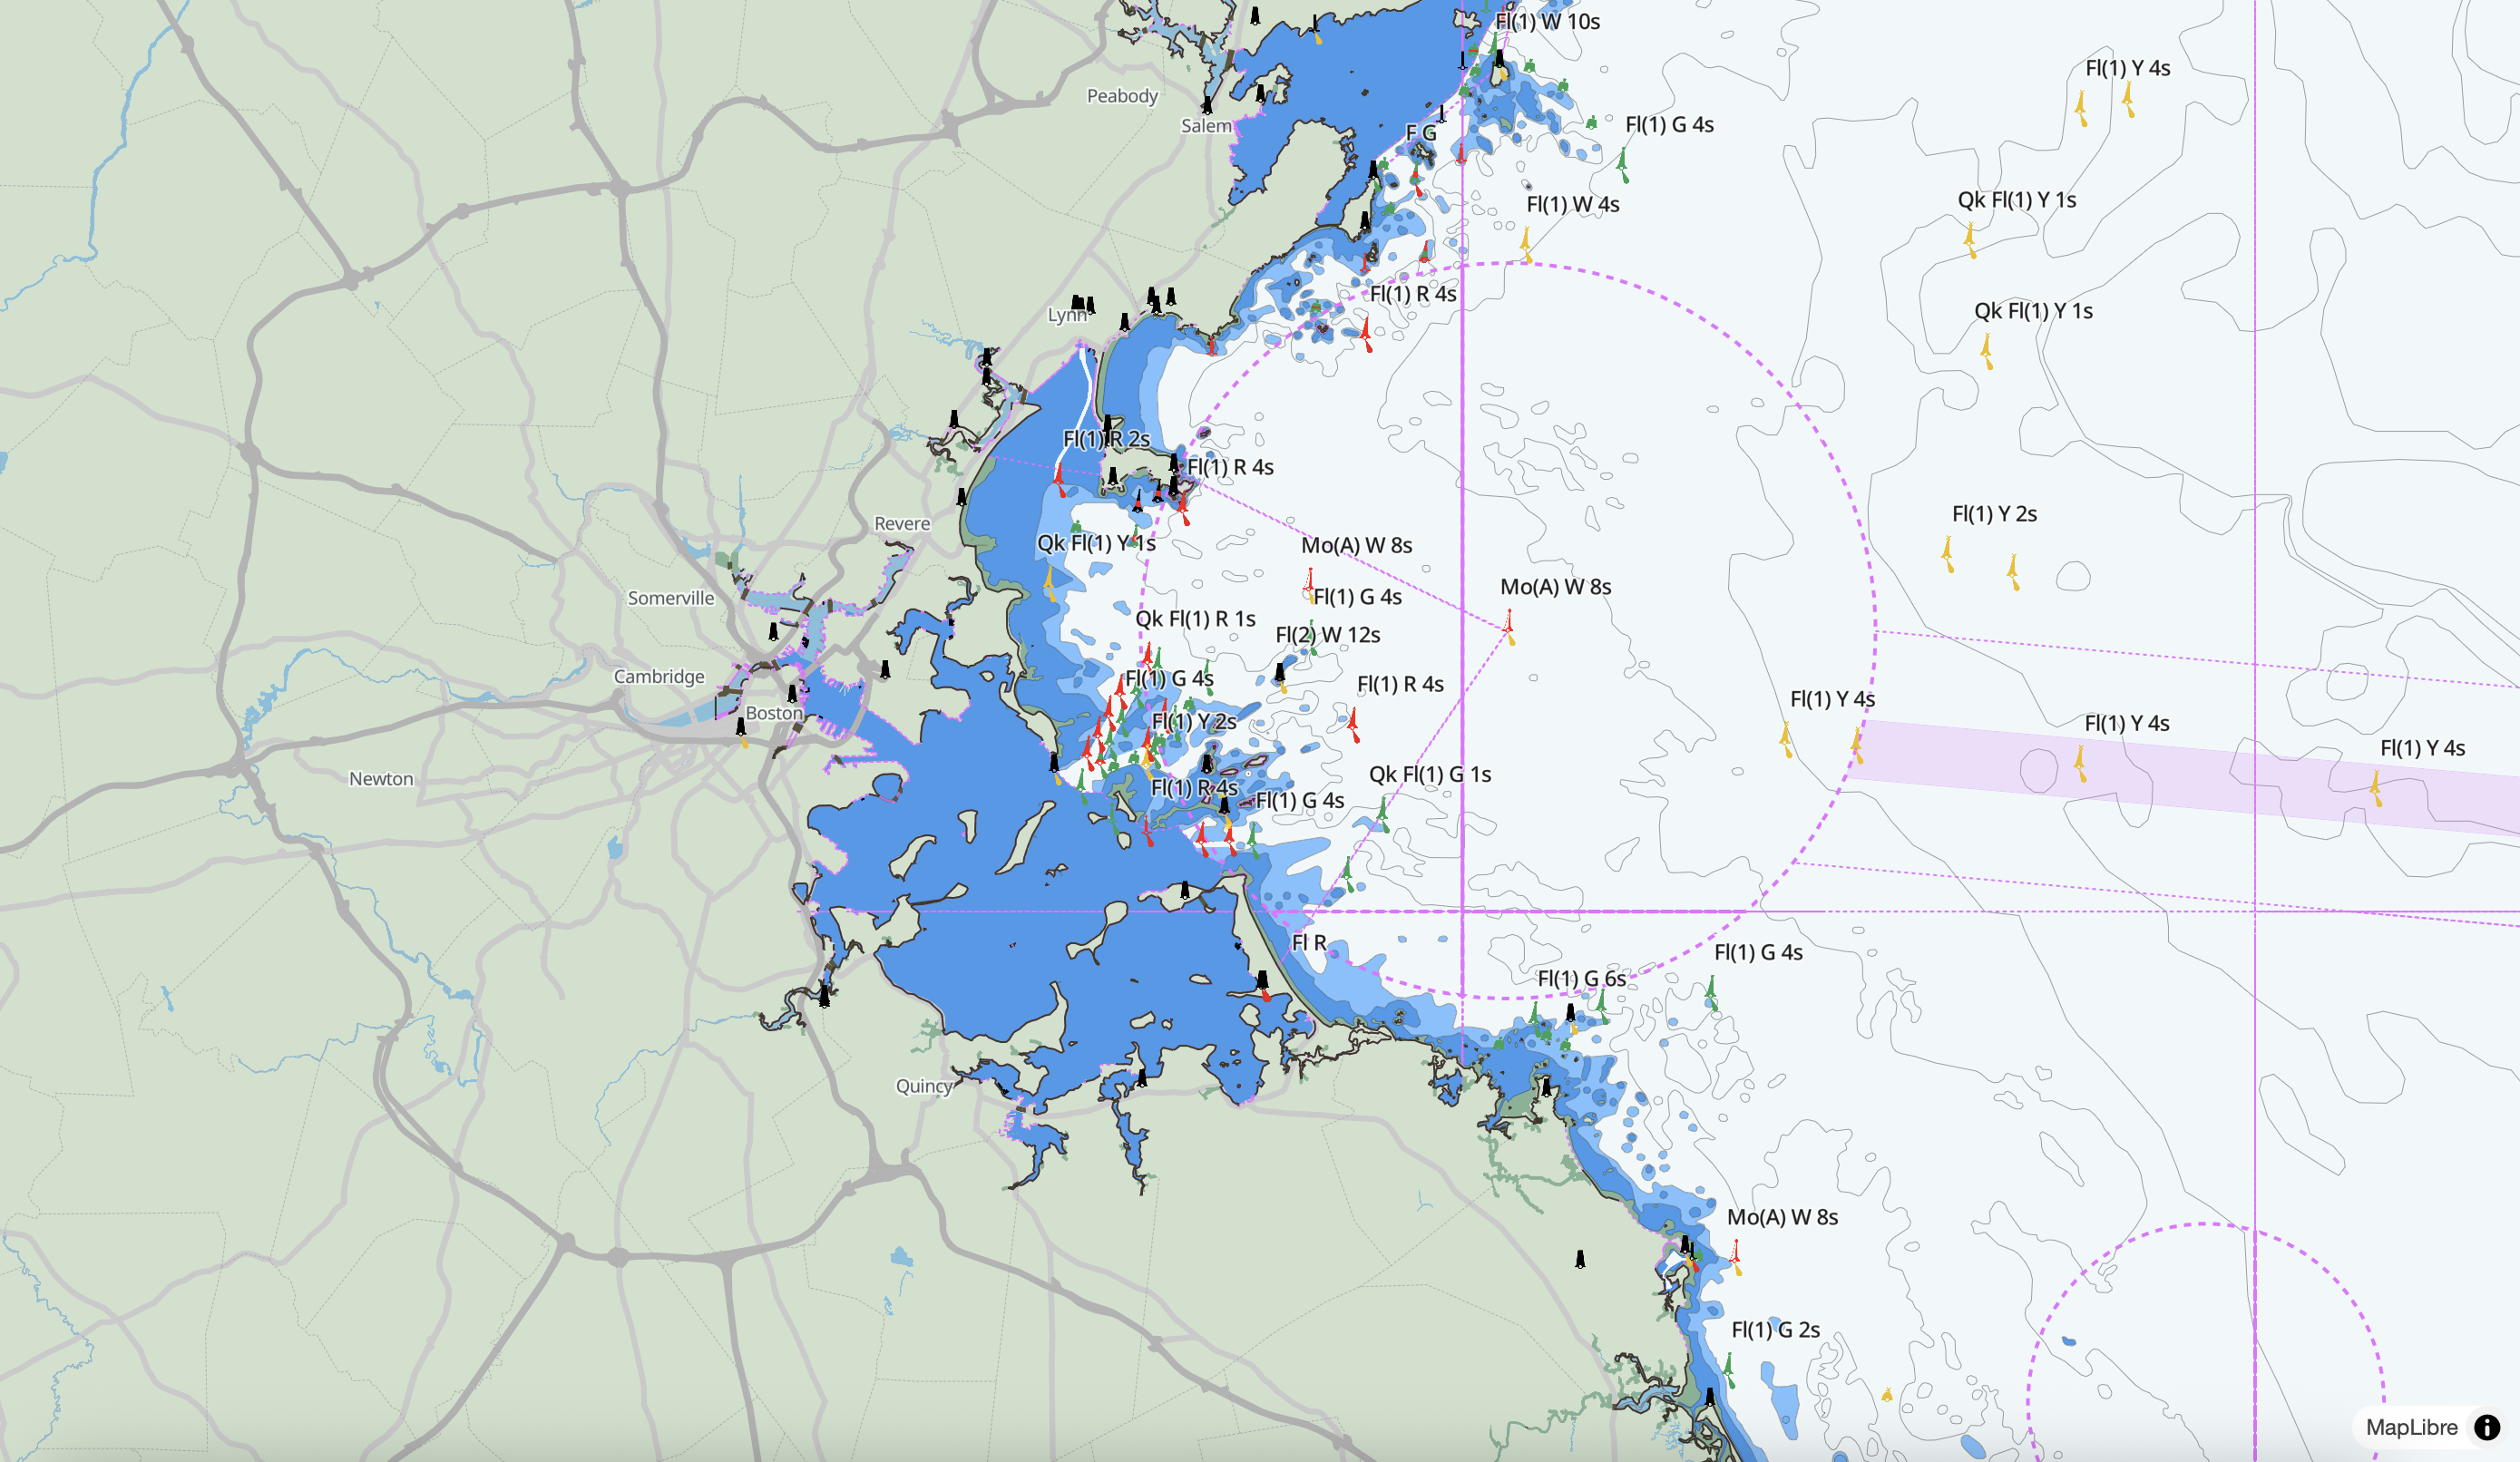
Replace YOUR_TOKEN with your API token (sign up for free beta access), open the file in a browser, and you’ll see an interactive NOAA chart of Boston Harbor — depth areas, coastline, buoys, lights, and sounding labels all included.
That’s the entire setup. The style endpoint handles everything.
Using npm and a bundler
If you’re working in a React, Vue, or Svelte project, install MapLibre GL as a dependency:
npm install maplibre-glThen use the style URL the same way. Here’s a minimal React component:
import { useEffect, useRef } from 'react';
import maplibregl from 'maplibre-gl';
import 'maplibre-gl/dist/maplibre-gl.css';

export default function MarineChart({ token, center = [-70.9, 42.35], zoom = 10 }) {
  const mapContainer = useRef(null);

  useEffect(() => {
    const map = new maplibregl.Map({
      container: mapContainer.current,
      style: `https://tiles.marinecharts.io/api/style?token=${token}`,
      center,
      zoom
    });

    return () => map.remove();
  }, []);

  return <div ref={mapContainer} style={{ width: '100%', height: '500px' }} />;
}
What’s in the style
The style includes the full ENC layer stack derived from NOAA S-57 data. Some of the key layers:
| Layer | What it shows |
|---|---|
depare |
Depth areas, colour-graded by depth (drval1) — darker blue = deeper |
soundg |
Individual sounding labels, visible from zoom 11 |
depcnt |
Depth contour lines |
coalne |
Coastlines |
lndare |
Land fill |
boylat, boycar, boyspp |
Lateral, cardinal, and special-purpose buoys with icons |
bcnlat, bcncar |
Lateral and cardinal beacons |
lights |
Navigational lights with icon and label |
light_arcs |
Coloured light sector arcs |
fairwy |
Fairway areas |
tssbnd, tselne, tsezne |
Traffic separation scheme boundaries and lanes |
drgare |
Dredged areas |
achare |
Anchorage areas |
Buoy and beacon layers use sprite icons matched by the icon_id attribute, so each mark renders with its correct shape and colour automatically. You can examine the layers in more detail using our vector tile inspector.
Customising the style
The style URL is a starting point, not a constraint. You can fetch the JSON, modify it, and pass the object directly to MapLibre:
const res = await fetch('https://tiles.marinecharts.io/api/style?token=YOUR_TOKEN');
const style = await res.json();

// Change depth area colours
const depare1 = style.layers.find(l => l.id === 'depare_1');
if (depare1) depare1.paint['fill-color'] = '#0066cc';

// Hide soundings
const soundg = style.layers.find(l => l.id === 'soundg');
if (soundg) soundg.layout.visibility = 'none';

const map = new maplibregl.Map({
  container: 'map',
  style,
  center: [-70.9, 42.35],
  zoom: 10
});
Or add your own layers on top after the map loads:
map.on('load', () => {
  // Highlight shallow areas (< 2m) in your vessel's danger colour
  map.addLayer({
    id: 'danger-shallows',
    type: 'fill',
    source: 'enc',
    'source-layer': 'depare',
    filter: ['all', ['>=', ['get', 'drval1'], 0], ['<=', ['get', 'drval1'], 2]],
    paint: { 'fill-color': '#ff3300', 'fill-opacity': 0.4 }
  });
});
Adding click popups
MapLibre data-driven popups let you inspect any ENC feature directly:
map.on('click', 'soundg', (e) => {
  const depth = e.features[0].properties.depth;

  new maplibregl.Popup()
    .setLngLat(e.lngLat)
    .setHTML(`<strong>Depth:</strong> ${parseFloat(depth).toFixed(1)} m`)
    .addTo(map);
});

map.on('mouseenter', 'soundg', () => map.getCanvas().style.cursor = 'pointer');
map.on('mouseleave', 'soundg', () => map.getCanvas().style.cursor = '');
The same pattern works for any layer — click a buoy to see its object name, click a depth area to see its range.
What’s next
From here you can:
- Go mobile — MapLibre has iOS and Android SDKs that accept the same style URL
- Overlay AIS data — add a GeoJSON source with real-time vessel positions
- Filter by draft — use MapLibre expressions to highlight areas shallower than your vessel’s draft in real time
- Build a route planner — combine depth data with a user-drawn line to flag hazards along a planned route
The Marine Charts API reference covers the full layer and attribute schema, coverage regions, and tile zoom levels.
Questions or feedback? Email support.